Shari Chin

Data Analyst
Creative Problem Solver
Results Driven
View My LinkedIn Profile
Analysis of Massachusetts State Education Overview
How does class size affect college admission?
Introduction
For this project, I focused on analyzing education information for the state of Massachusetts from the perspective of an education Superintendent. I used a data set compiled from multiple reports taken from the Massachusetts Department of Education website to build a report showing the status of the school system.
Key Insights
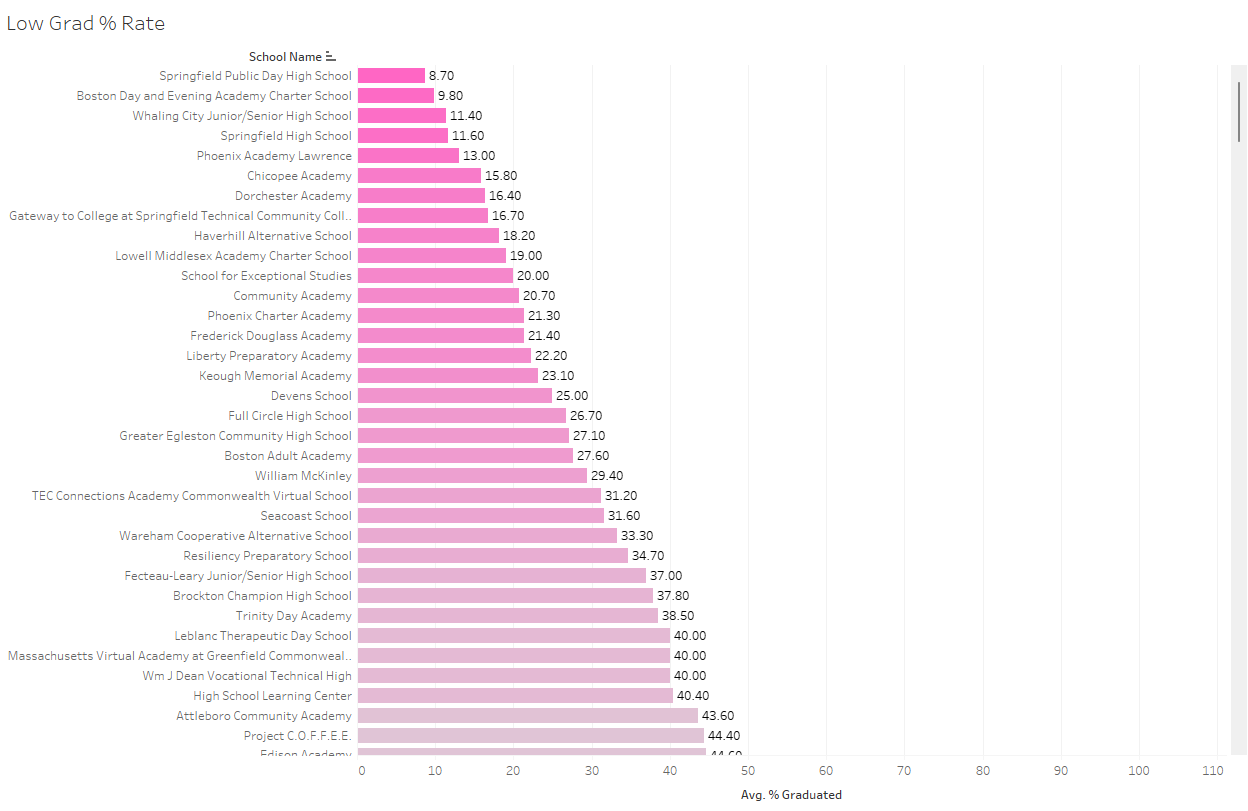
- The bottom 10 high schools have a graduation percent rate between 8.7% to 19.0%
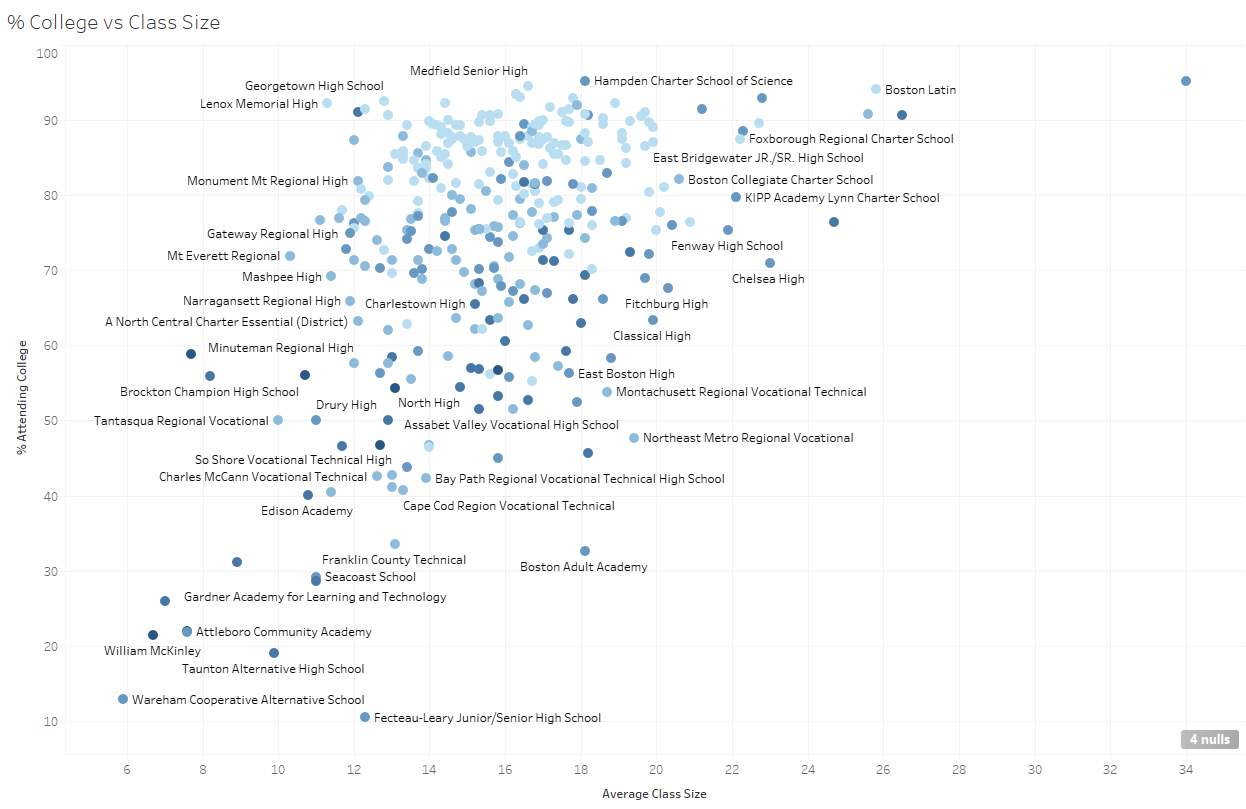
- The high school with the highest average amount of graduating students at 95% had an average class size of 34 students per class.
- Class size does not have an effect on college admission.
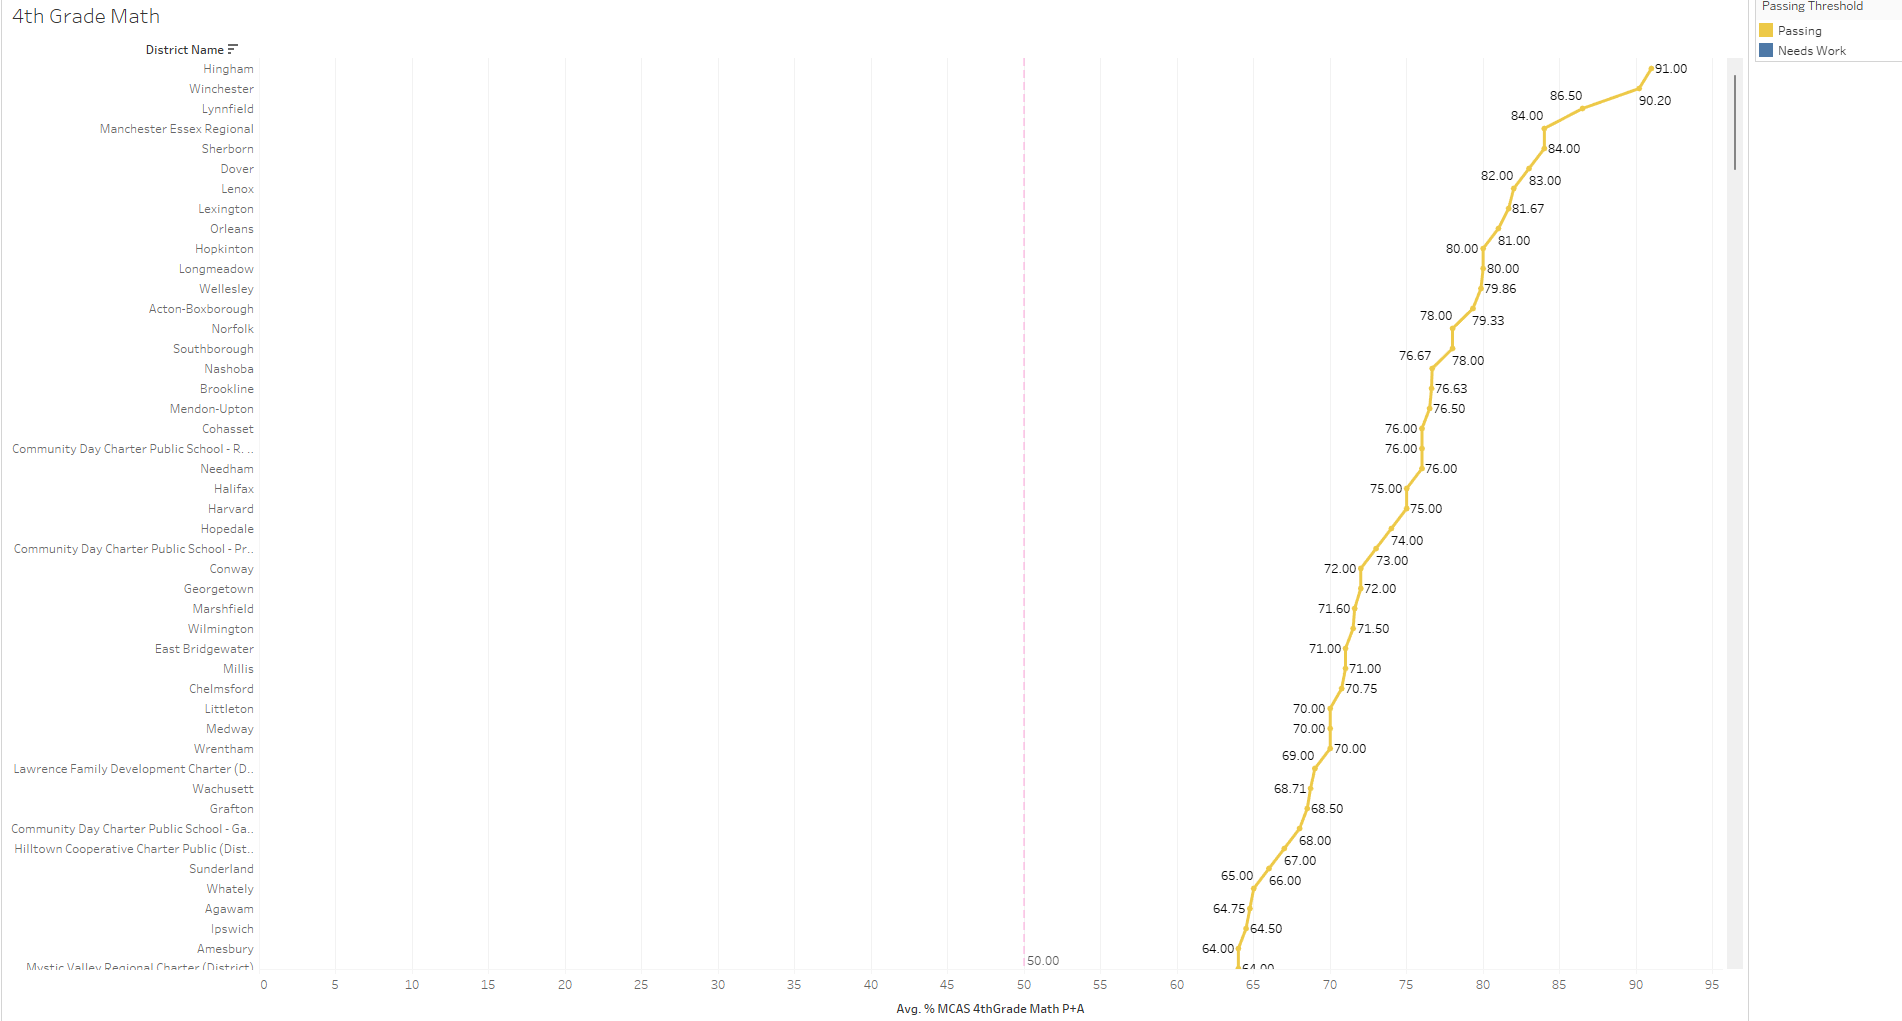
- The top 10 elementary schools with the highest 4th grade MCAS test scores have score averages ranging from 80.0 to 91.0.
The Data
The reports used to compile the data set were taken from the Massachusetts Department of Education website. The state website has yearly school reports dated from 2006 to 2022. This data set uses data from 2017 and is publicly available on Kaggle. It can be used for EDA, statistical analysis, and visualizations.
A description of the dataset and data dictionary were provided to help define the columns and information provided.
I used Excel to explore and become familiar with the 1861 columns and 298 rows provided. After exploring with Excel, I used Tableau to create the visualizations needed for the dashboard report.
The data included the following:
- Enrollment by Grade
- Enrollment by Selected Population
- Enrollment by Race/Gender
- Class Size by Gender and Selected Populations
- Teacher Salaries
- Per Pupil Expenditure
- Graduation Rates
- Graduates Attending Higher Education
- Advanced Placement Participation
- Advanced Placement Performance
- SAT Performance
- MCAS Achievement Results - Massachusetts Comprehensive Assessment System test
- Accountability Report
The Project
The main aim of this project was to ask myself questions and take on the role of an Education Secretary or School Superintendent. I asked questions from an education perspective to find insights into the Massachusetts education school system from elementary school students to students graduating high school.
The main questions I set out to answer were:
- What are the schools that are struggling the most?
- How could college attendance be increased?
- Which schools are considered economically disadvantaged and still have high college attendance rates?
- Which districts have the highest math scores in the state?
The Analysis + Commentary
To answer my first question on what schools were struggling the most, I chose to summarize the data and find the bottom 10 high schools. By using the average graduation percent rate, I created a horizontal bar chart to show the relationship between the average percent of students graduating from each high school on the x-axis and the school name on the y-axis. This resulted in the following chart showing Springfield Public Day High School with an average of 8.70 percent of students graduating high school compared to South Shore Charter Public School with a graduating average of 100 percent.

After I grouped the data and found the bottom 10 high schools struggling the most with getting students to graduate, I explored the data further to find if class size could help increase graduation and college attendance rates.
To find whether there was a relationship between class size and college graduation rates, I created a scatter plot using the average class size as the independent variable on the x-axis and the average percent of students attending college as the dependent variable on the y-axis.
The scatter plot below shows that as the average class size increased the average amount of students attending college was not affected. Boston Preparatory Charter School has the highest average college attendance rate at 95% with an average class size of 34 students and is an anomaly amongst the other high schools. While the school with the lowest average college attendance rate at 12.90%, Wareham Cooperative Alternative School had an average class size of 6 students and is another outlier among the participating schools. However, most of the schools boxed in the center have similar college attendance rates and class size averages.
Because increasing class size did not result in an increase in college attendance rates, I explored the data to find out why. I asked myself, out of the following schools with students attending college, which of them would be considered economically disadvantaged?
To find this, I filtered the data further to add a blue color gradient to see which schools had a high amount of students considered economically disadvantaged attending school. The data points in dark blue are shown in various locations from low average class size to high average class size. Using WM J Dean Vocational Technical School as an example with an average of 83% economically disadvantaged, an average class size of 12.70, and a 46% college attendance rate, the chart shows that even schools with a high amount of economically disadvantaged students can have low-class sizes and high college attendance rates.

Up until this point, I focused on high schools and students’ college attendance rates. Now I shifted my focus to elementary schools to find what areas schools could play a role in students’ success before reaching high school.
The state of Massachusetts believes the MCAS 4th Grade Math test scores could play a role in students’ success. I used the Avg % MCAS 4th Grade Math P + A metric and the district name metric to create a line chart showing the top 10 districts with the highest average passing rate over 50%. We can use this data to see which methods the high-performing districts were using and train teachers to replicate these methodologies in low-performing districts that need improvement. Hingham Elementary was the top school with an Avg % MCAS score of 91%. Hingham Elementary has the highest average score of 91%, while Westfield Elementary’s score is just 49%. What sets Hingham and Winchester apart?

Insights and Recommendations
With this report, I recommend the state not build more high schools for the purpose of increasing students’ college attendance rates. I would suggest the state focus its efforts on replicating high-performing teaching methodologies in low-performing schools.
Summary
I enjoyed exploring and building data visualizations related to the Massachusetts state education school system. Taking on the role of a school superintendent and applying perspective thinking, allowed me to ask questions that could provide actionable value.