Shari Chin

Data Analyst
Creative Problem Solver
Results Driven
View My LinkedIn Profile
Analysis of 1999-2008 Hospital Operations in the United States
What’s the average number of days a patient stays in the hospital?
Introduction
In this project, I chose to practice SQL querying from multiple sources to provide analysis of hospital care and patient information. When it concerns patient care, there is a fine line between balancing business productivity and customer service. As a professional who has construction experience helping to remodel hospital rooms, I’ve wondered how hospitals forecast the number of different diseases and people they can help each year let alone people each month. Oftentimes it takes between 6 to 36 months (sometimes 5 years) to take an Owner’s requirements and budget through pre-planning, design, budgeting, and more planning through construction. Taking this knowledge into perspective can help understand why managing patient turnover in hospital beds would be an important part of business operations.
Objective
I’ve been asked to provide various lists using patient statistics.
Here are a few questions I set out to answer:
- What does the distribution of time a patient spends in the hospital look like? Do the majority of patients stay less than 7 days?
- What are the 5 most common medical specialties?
- Which medical specialties have the highest number of procedures?
- Does the number of lab procedures a patient receives affect the number of days a patient stays in the hospital?
- Does patient demographics like race influence the number of lab procedures needed?
Key Insights
- The average number of days a patient spends in the hospital is 4.4 days, and 85% of patients spend less than 7 days in the hospital.
- There are 73 different medical specialties with the 5 most common medical specialties associated with unknown, internal medicine, emergency/trauma, family practice/ general medicine, and cardiology.
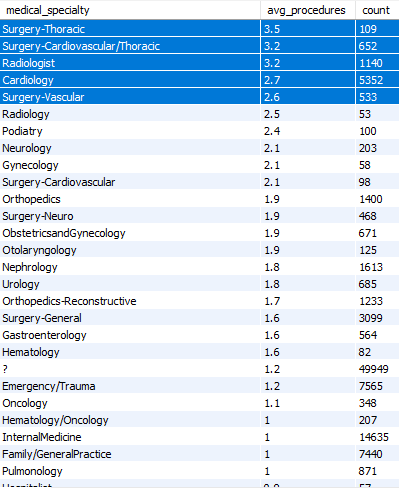
- Surgery-thoracic, Surgery-Cardiovascular/Thoracic, Radiologist, Cardiology, and Surgery-Vascular are the 5 medical specialties with the highest average number of procedures.
- The more lab procedures a patient has the longer a patient stays in the hospital or vice-versa.
- Among the 6 identified racial categories, the average number of lab procedures is within a small margin of one another, from 40.9 to 44.1.
The Data
The hospital information contained in this dataset was taken from the University of California Machine Learning Repository. This dataset represents ten years (1999-2008) of clinical care at 130 US hospitals and integrated delivery networks. Each row is a hospital record for a patient diagnosed with diabetes who underwent laboratory work, was given medications, and stayed at the hospital from 1 to 14 days.
The dataset can also be found on Kaggle. It contains 101,766 rows (101,765 as patients) and 52 attributes divided into 2 separate tables. An extensive data dictionary can be found here. Only the following 8 attributes were used in this analysis:
- patient_nbr
- admission_type_id
- time_in_hospital
- medical_specialty
- num_lab_procedures
- num_procedures
- num_medications
- race
The Analysis + Commentary
What does the distribution of time a patient spends in the hospital look like? Do the majority of patients stay less than 7 days?
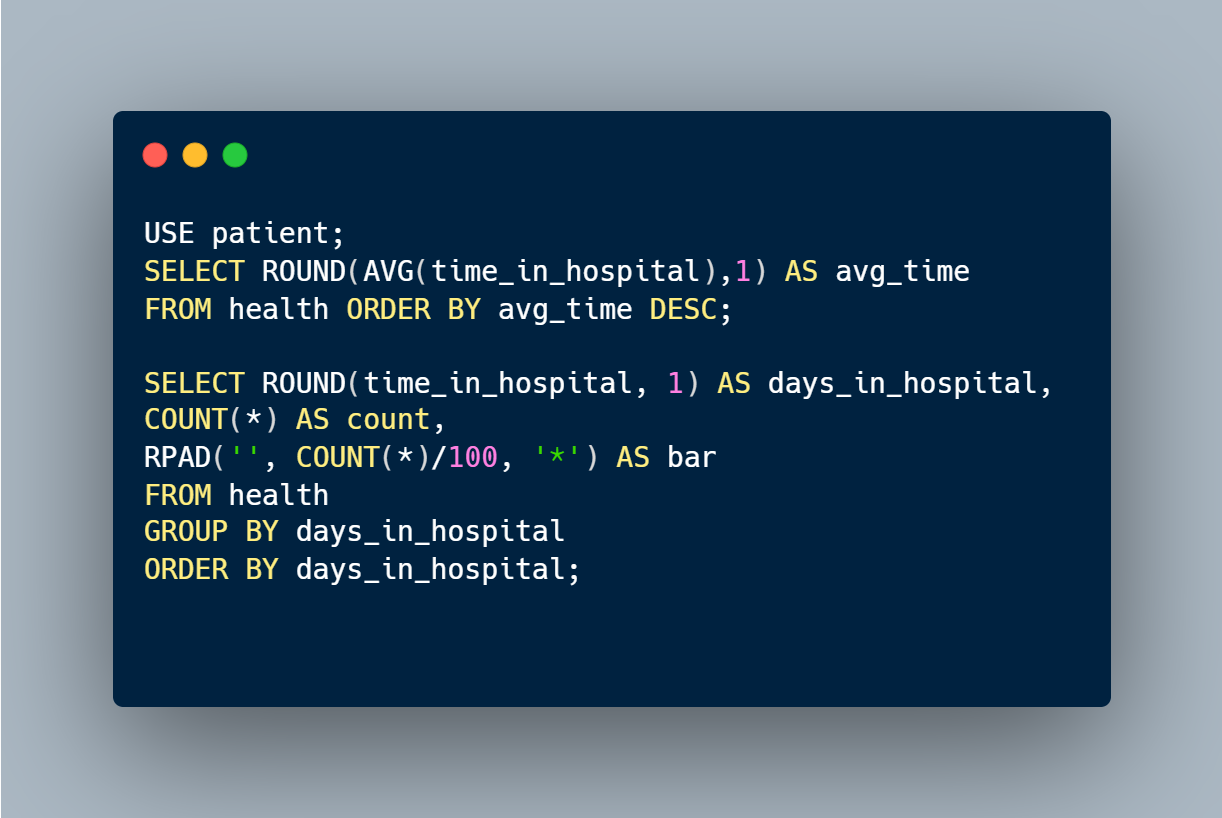
In the following queries above I used the time_in_hospital metric to find the average number of days a patient stayed in the hospital. The results showed 4.4 days as the average time a patient spends in the hospital and further analysis showed 85% of patients stayed in the hospital for less than 7 days. SQL is typically not the best way to show visualizations, but by using the RPAD function and division, this query can be depicted showing patients represented as “stars” or asterisks in the histogram plotted below.
What are the 5 most common medical specialties?
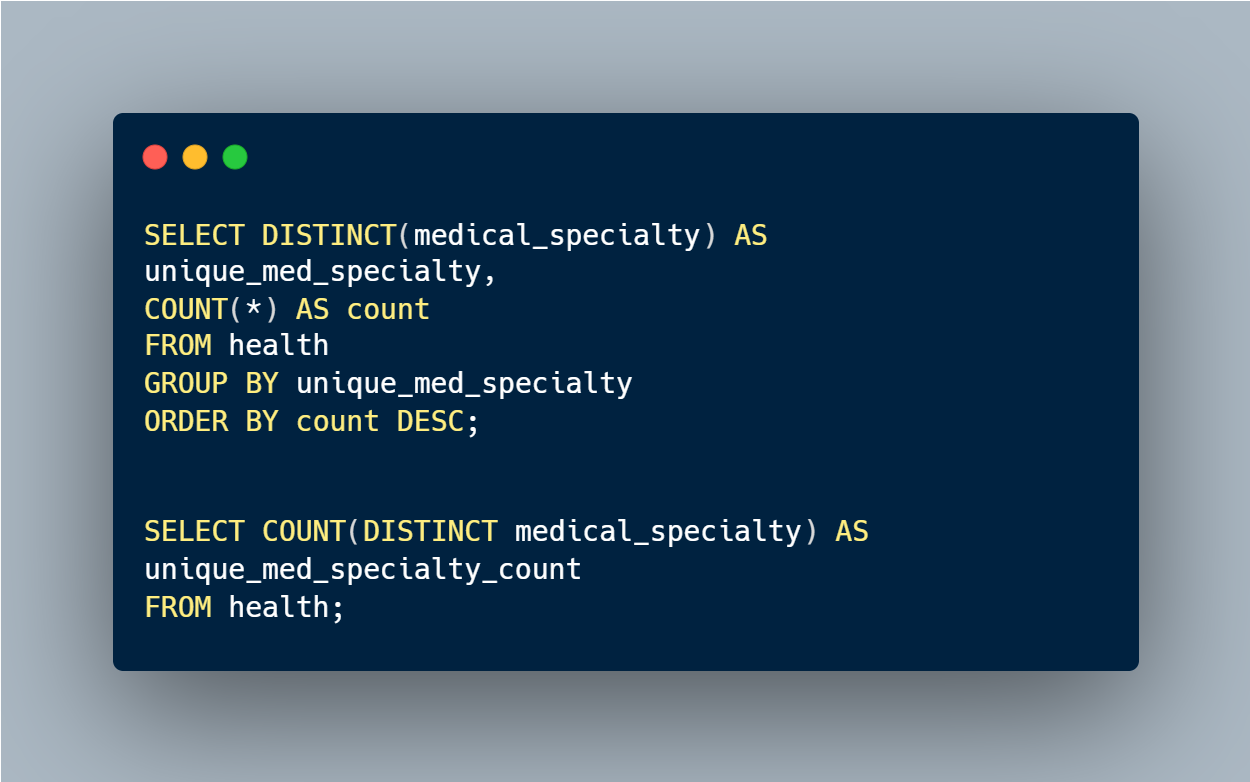
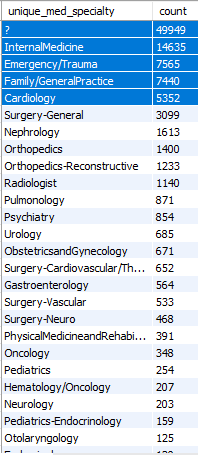
For this question, I used queries focused on finding the number of unique medical specialties the hospital performed and the specialties performed the most within the 130 hospitals and integrated delivery networks. Results showed there are 73 different medical specialties with the 5 most common medical specialties associated with unknown, internal medicine, emergency/trauma, family practice/ general medicine, and cardiology.
Which medical specialties have the highest number of procedures?
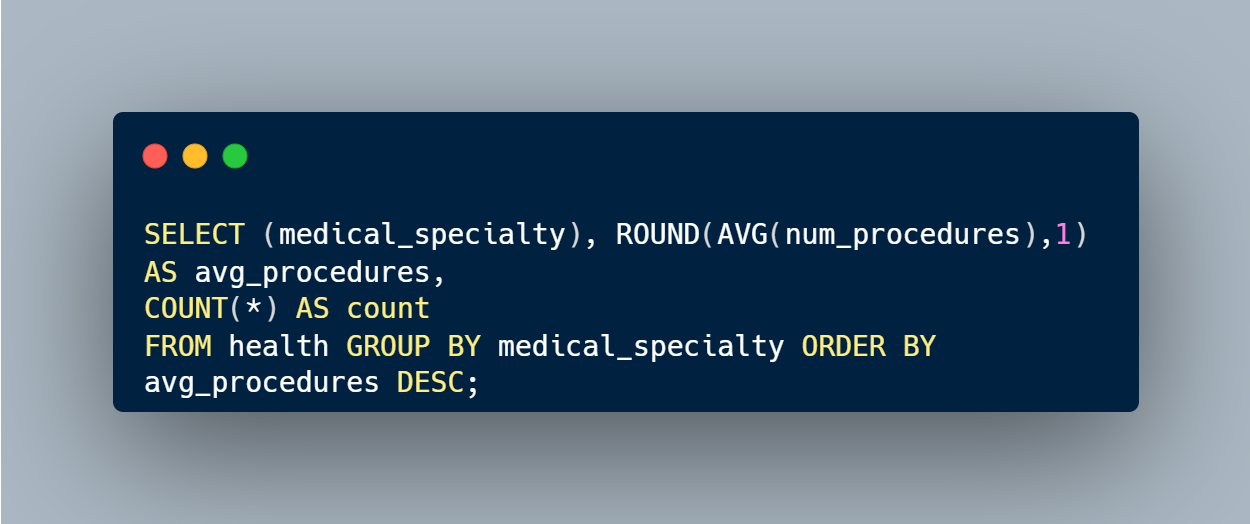
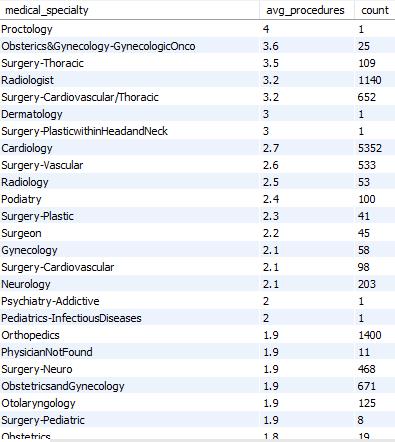
Because the queries used in question 2 focused on the number of medical specialties overall, I dived deeper into these initial queries to find the average number of procedures performed under the 5 most common medical specialties. The following query resulted in Proctology showing the medical specialty with the highest average number of procedures however the count showed 1, which may indicate an outlier. To account for outliers within the dataset, I did further analysis using the Having function.
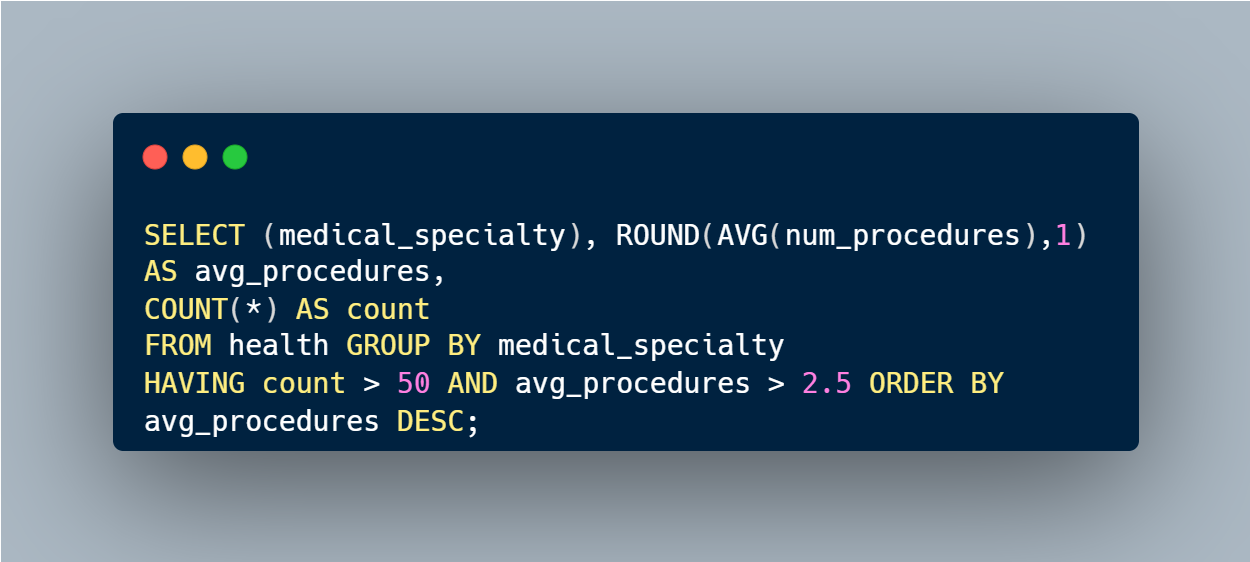
The Having function was used to filter for the medical specialty that had more than 50 patients and an average procedure of 2.5 or more. Now the results show Surgery-Thoracic, Surgery-Cardiovascular/Thoracic, Radiologist, Cardiology and Surgery-Vascular as the 5 medical specialties with the highest average number of procedures.
Does the number of procedures a patient receives affect the number of days a patient stays in the hospital?
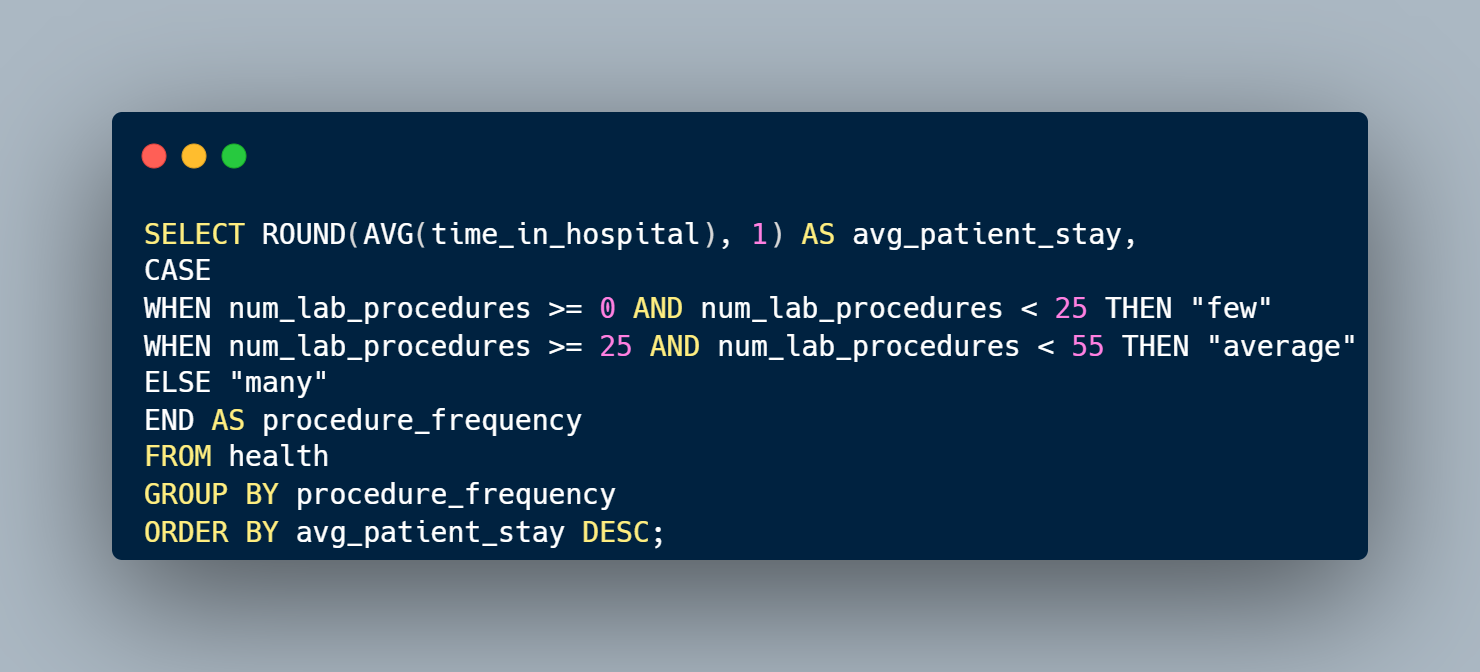
To find the answer, I broke this question into two parts. I found the average number of days a patient stayed in the hospital and the number of lab procedures a patient had. Then I separated the averages into 3 bins ranging from few; to average and then many using the case when command to separate the averages. The following results show a correlation between the number of lab procedures and the number of days a patient stays in the hospital. The longer a patient stays in the hospital the more lab procedures they have, or vice-versa.

To answer the following question, I used the JOIN command to combine two tables together. The patient’s health information was provided in one table while the patient’s demographics were in another. Then I used the patient number, race, and the number of lab procedure attributes to find the average number of lab procedures for the total number of patients grouped by race.

Does patient demographics like race influence the number of lab procedures needed?

The results indicate that, among the six identified racial categories, the average number of lab procedures is closely clustered, ranging from 40.9 to 44.1.
Insights and Recommendations
I enjoyed exploring hospital operations and patient healthcare information to practice SQL queries. If you enjoyed reading my analysis and are interested in knowing more, please feel free to connect with me on LinkedIn and check out my other projects!
