Shari Chin

Data Analyst
Creative Problem Solver
Results Driven
View My LinkedIn Profile
Welcome to My Portfolio
Learn About My Projects
Internal Blog Post Project
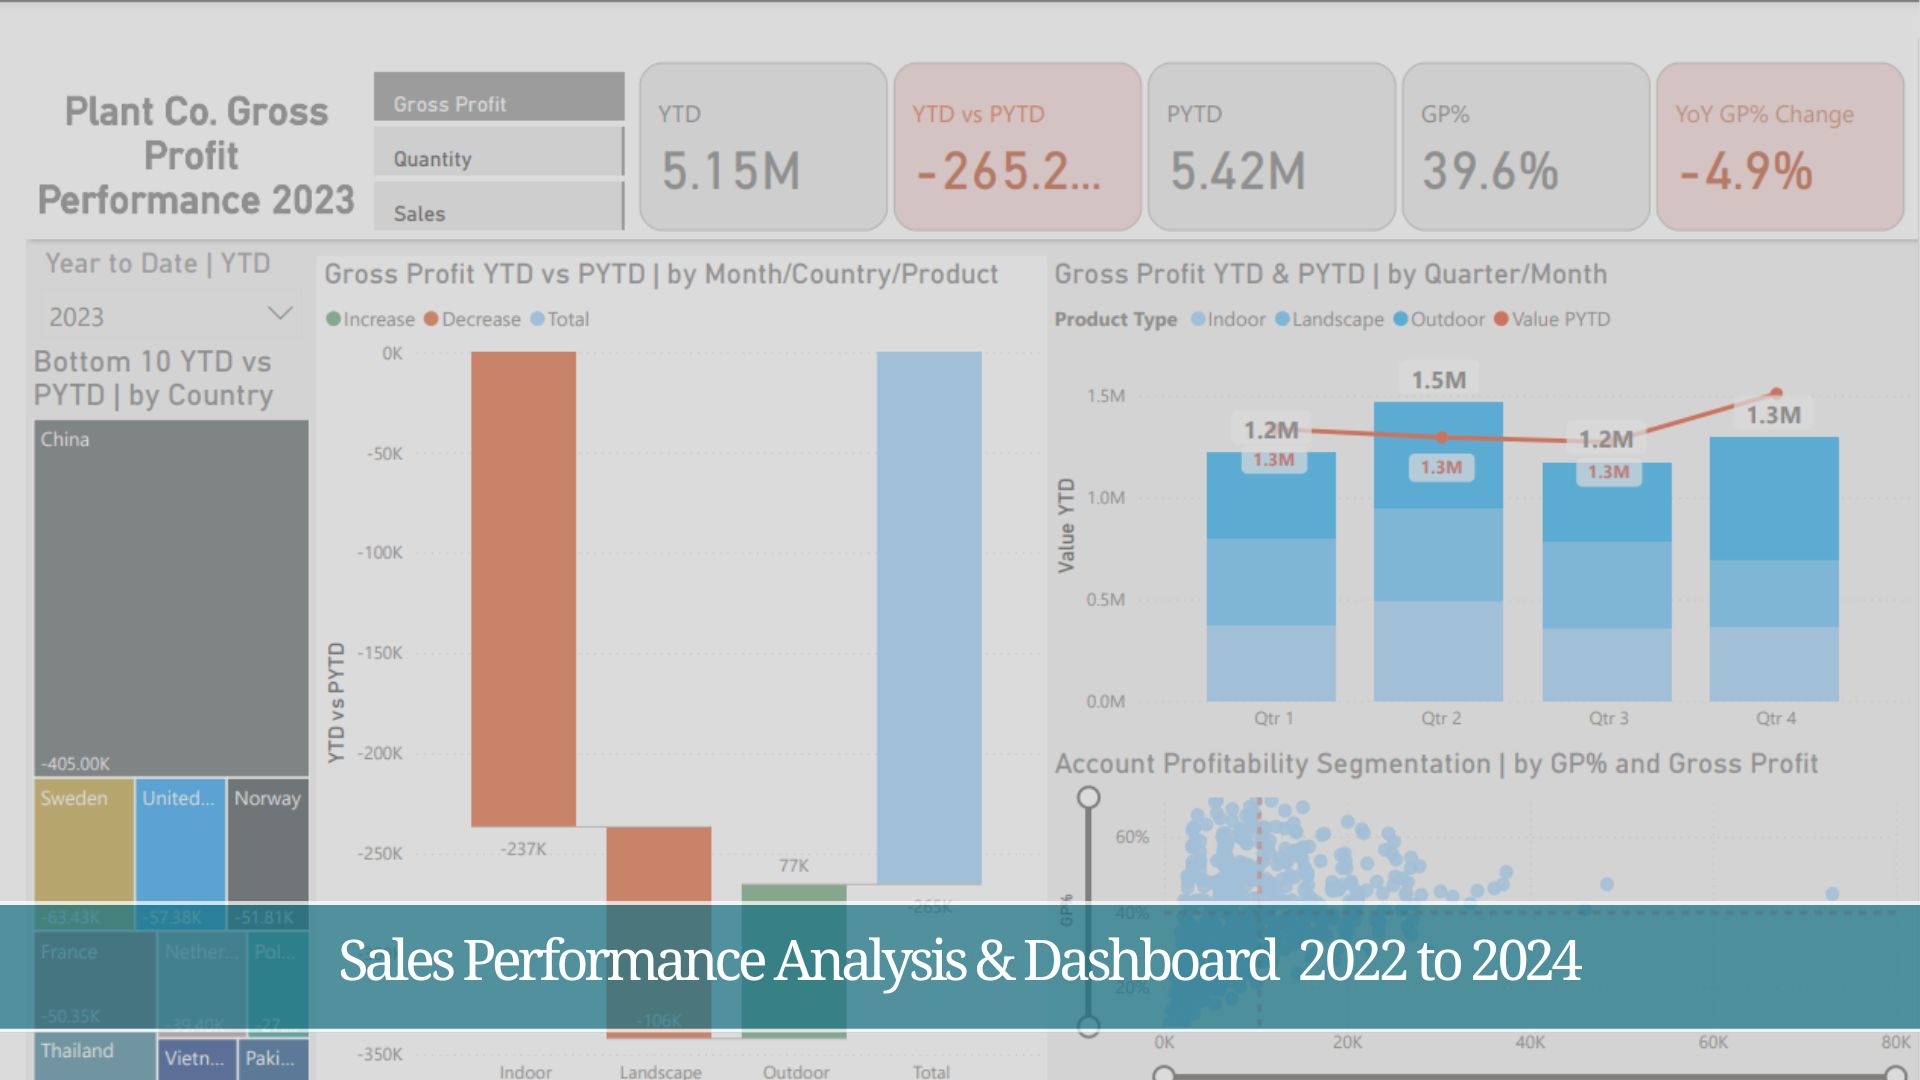 This analysis offers insights and recommendations for a global e-commerce plant supplier specializing in indoor and outdoor plants. I used Excel and PowerBI to clean, transform, and evaluate sales trends from 2022 to 2024, presenting key performance metrics in a dynamic dashboard. With an 11% decline in indoor plant sales and a 13% drop in gross profit, optimizing the cost of goods sold and implementing a re-pricing strategy for both top and underperforming indoor and landscape plants could create opportunities to boost revenue.
Click here to view video
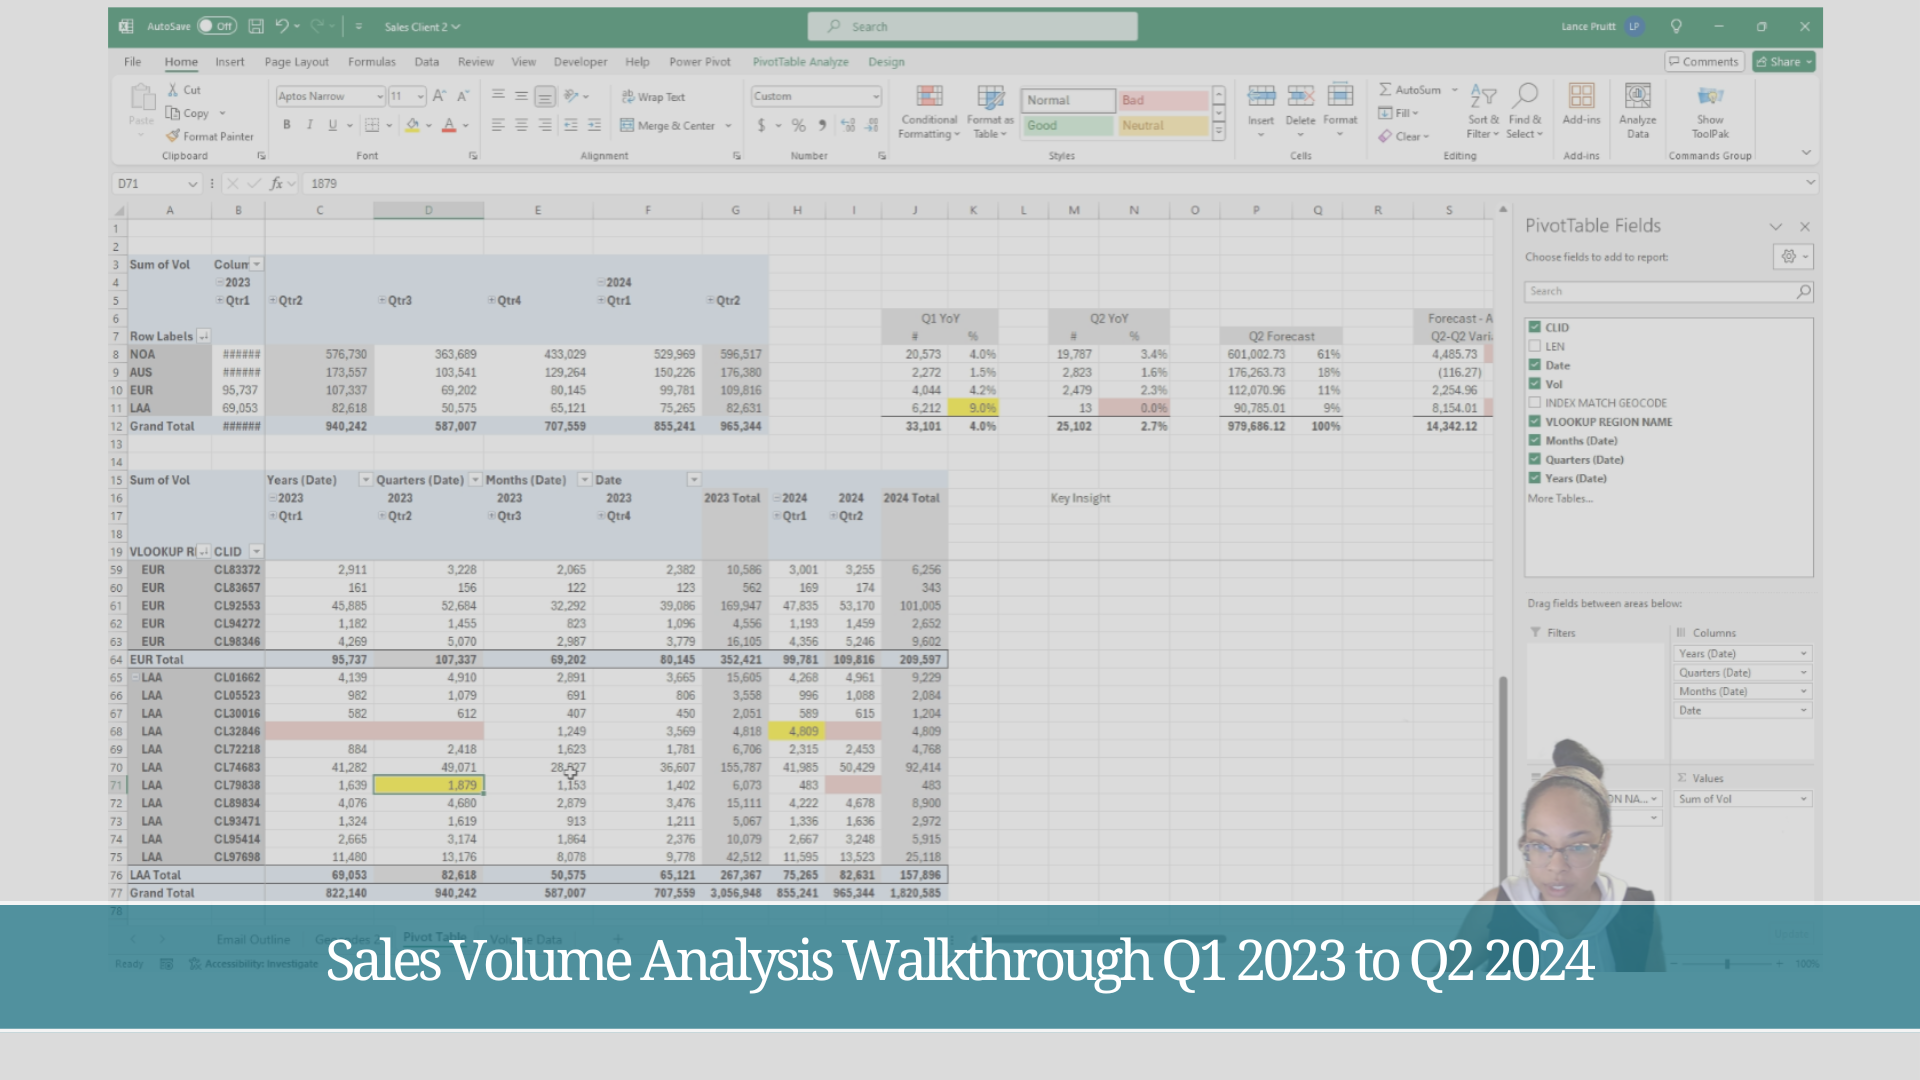 In this project, I used Excel to clean, analyze, and create a quarterly variance report for a client to investigate a decline in their Quarter 2 sales volume in one of their regions. I conducted a budget variance analysis and a simple forecast, concluding that the loss of two clients in the affected region resulted in a 7k volume decrease, which previously constituted 57% of the market share for the company in that region.
Internal Blog Post Project
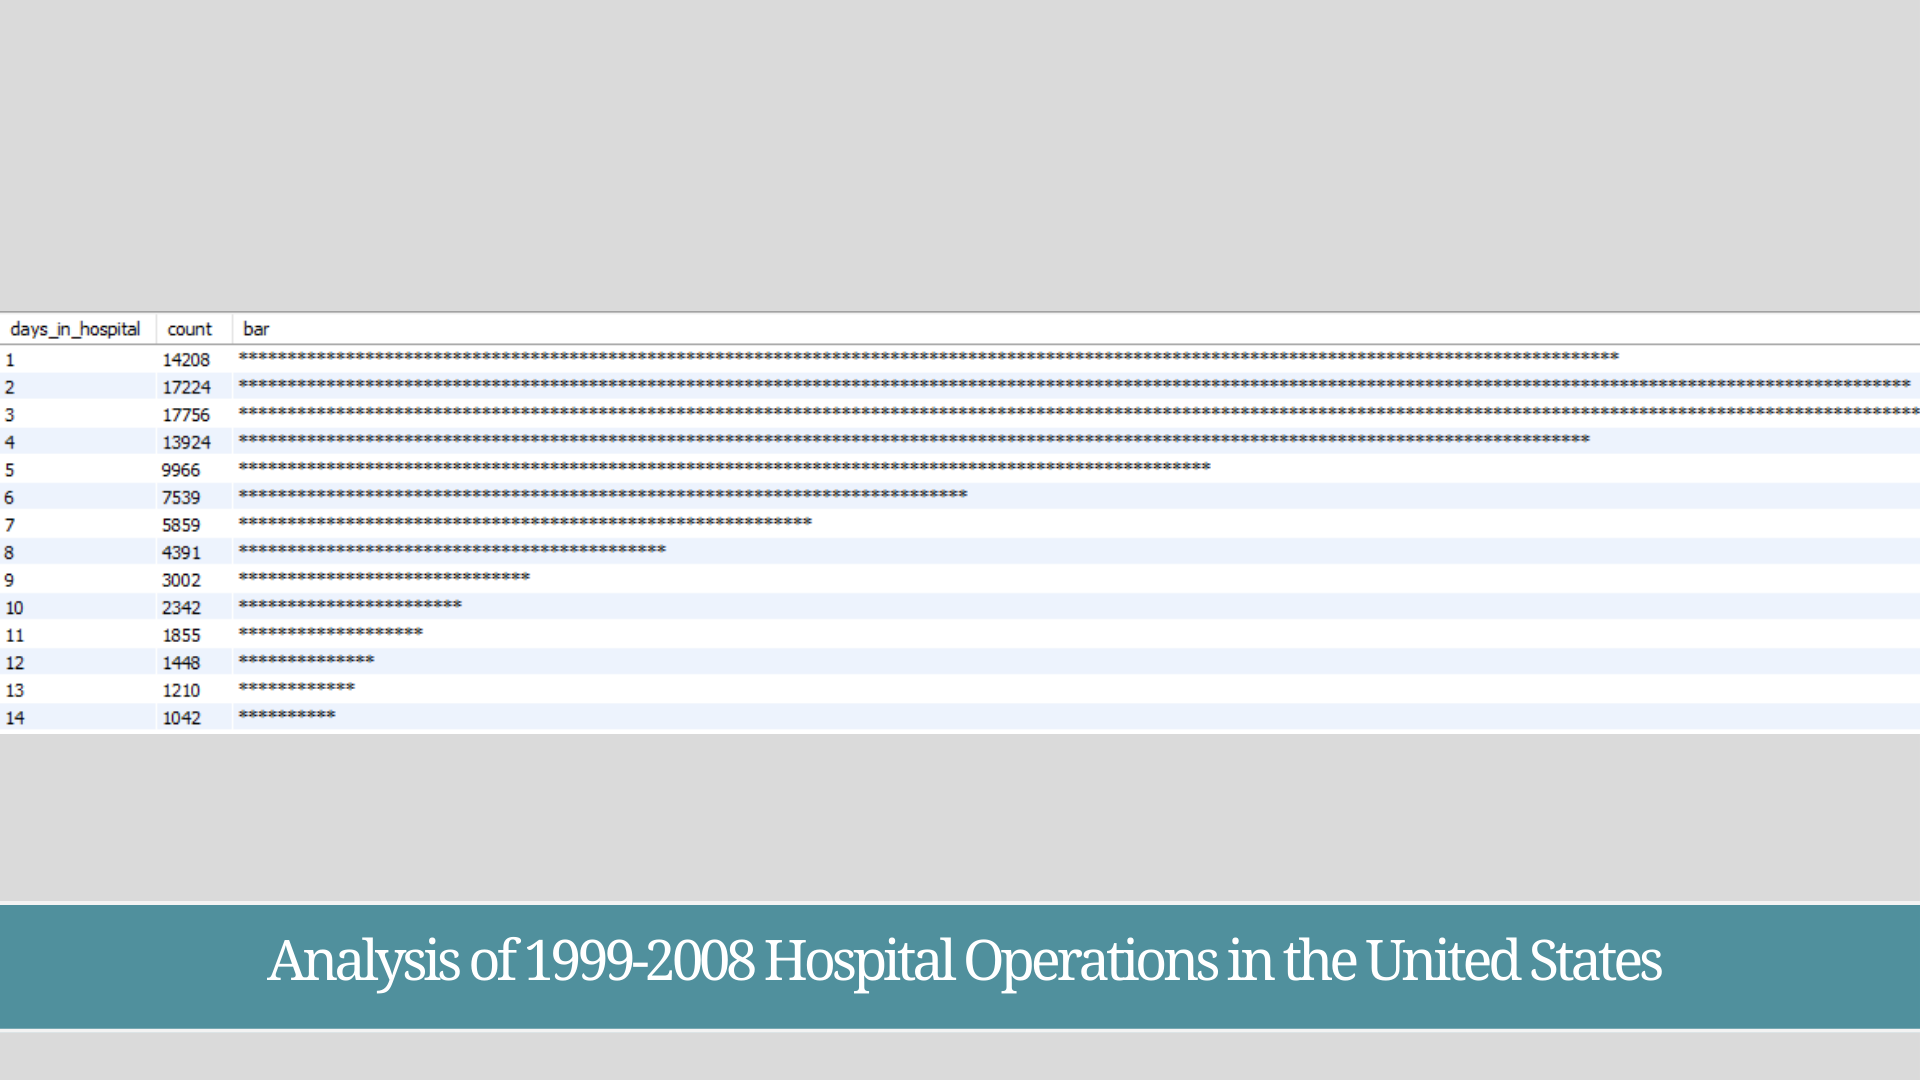 In this project, I chose to practice SQL querying from multiple sources to provide analysis of 1999-2008 hospital care and patient information from 130 hospitals. Since there is a fine line between balancing business productivity and customer service, I explored the data to understand why managing patient turnover in hospitals beds is an important part of business operations.
Internal Blog Post Project
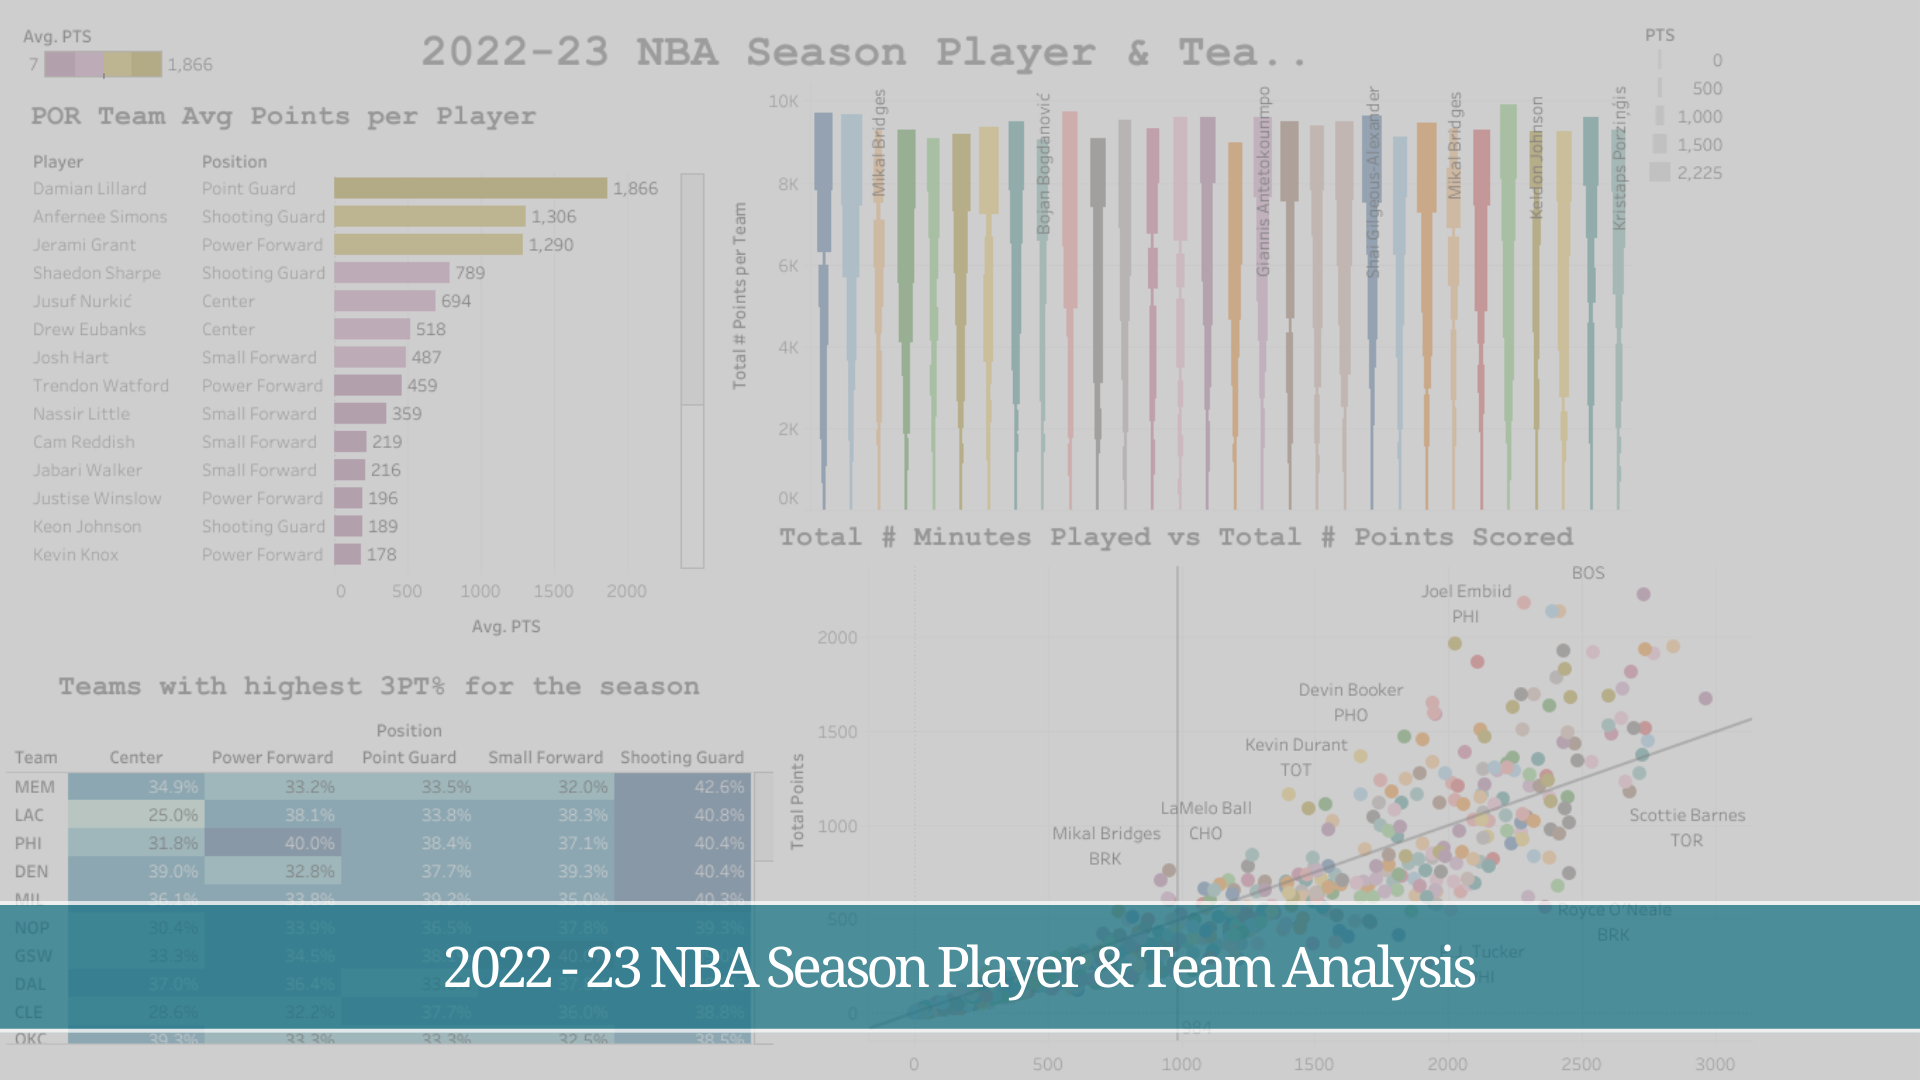 For this project, I analyzed basketball players’ individual and team performance from the 2022-2023 NBA Season. Since the data included both player and team statistics, I explored the details to identify areas players and teams could potentially improve in. Also in my analysis, I chose to highlight 4 teams (Miami Heat, Atlanta Hawks, Portland Trail Blazers and San Francisco Golden State Warriors) to showcase teams from the East and West coast in cities I’ve had the opportunity to experience and live in.
Click here to use dashboard
Click here to view Presentation
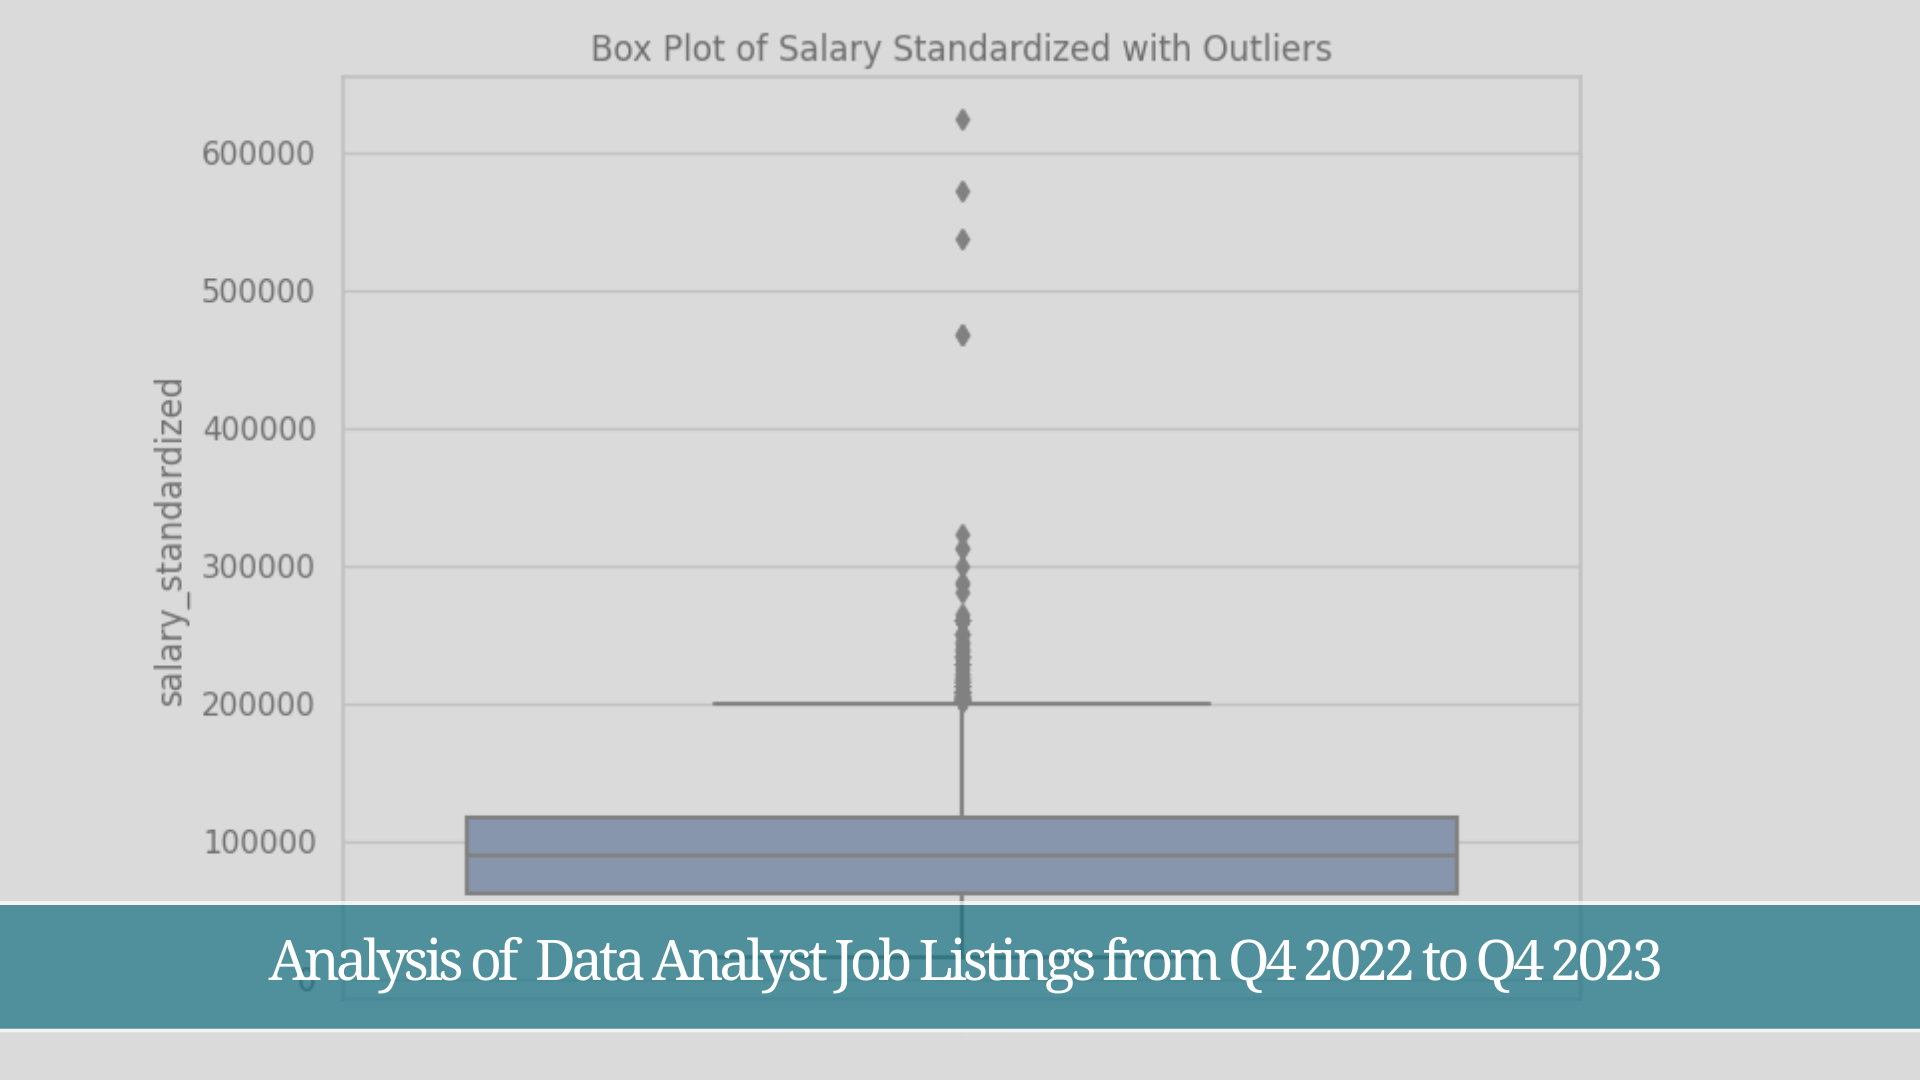 In this project, I gained experience working in a team through the full life cycle of a data project using Excel, Python and Tableau. This project is based on job posts webscraped from Google’s search results between Q4 2022 to Q4 2023. My role included leading the team; and preparing, processing and analyzing the dataset.
Click here to view Kaggle Code
Click here to use dashboard
Internal Blog Post Project
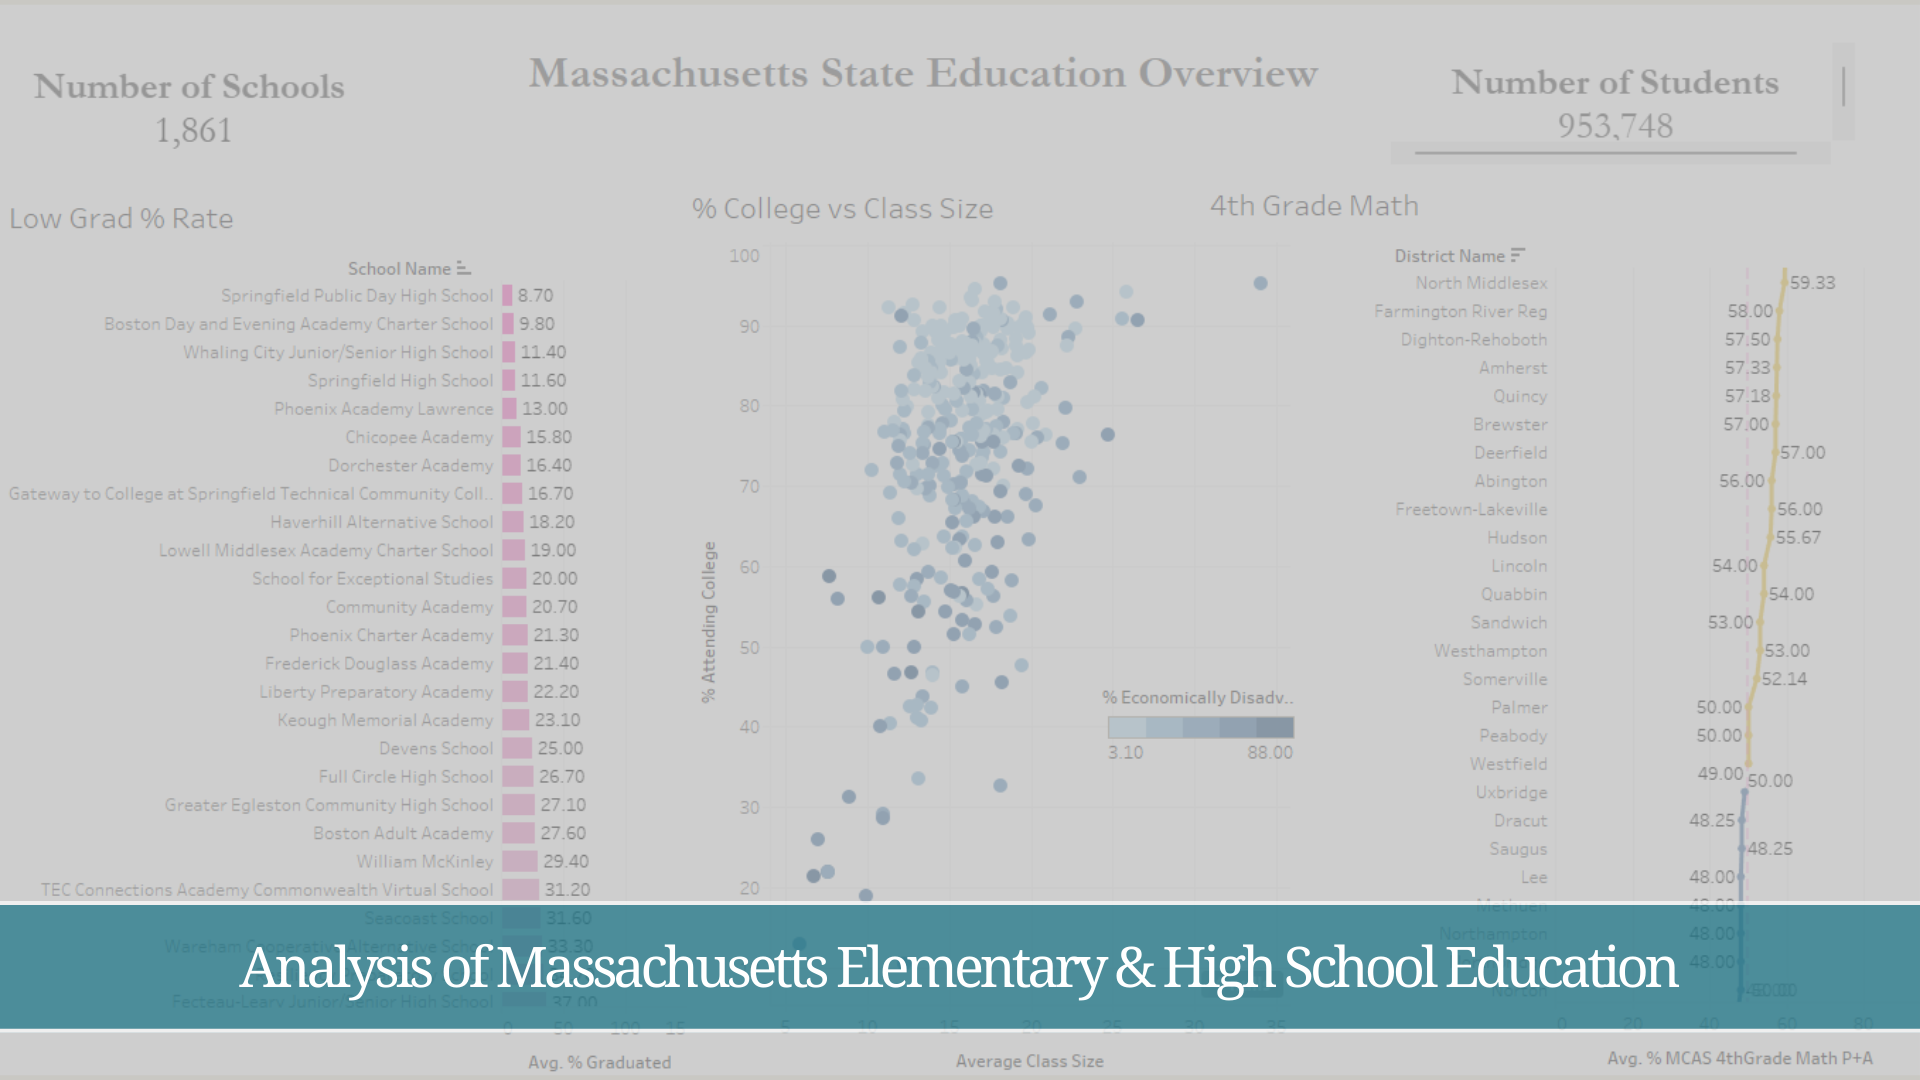 In this case study from the Data Analytics Accelerator, I was prompted to analyze the state of Massachusetts education data. The main focuses were:
What schools are struggling the most?
How does class size affect college admission?
What are the top math schools in the state?
Click here to view Presentation
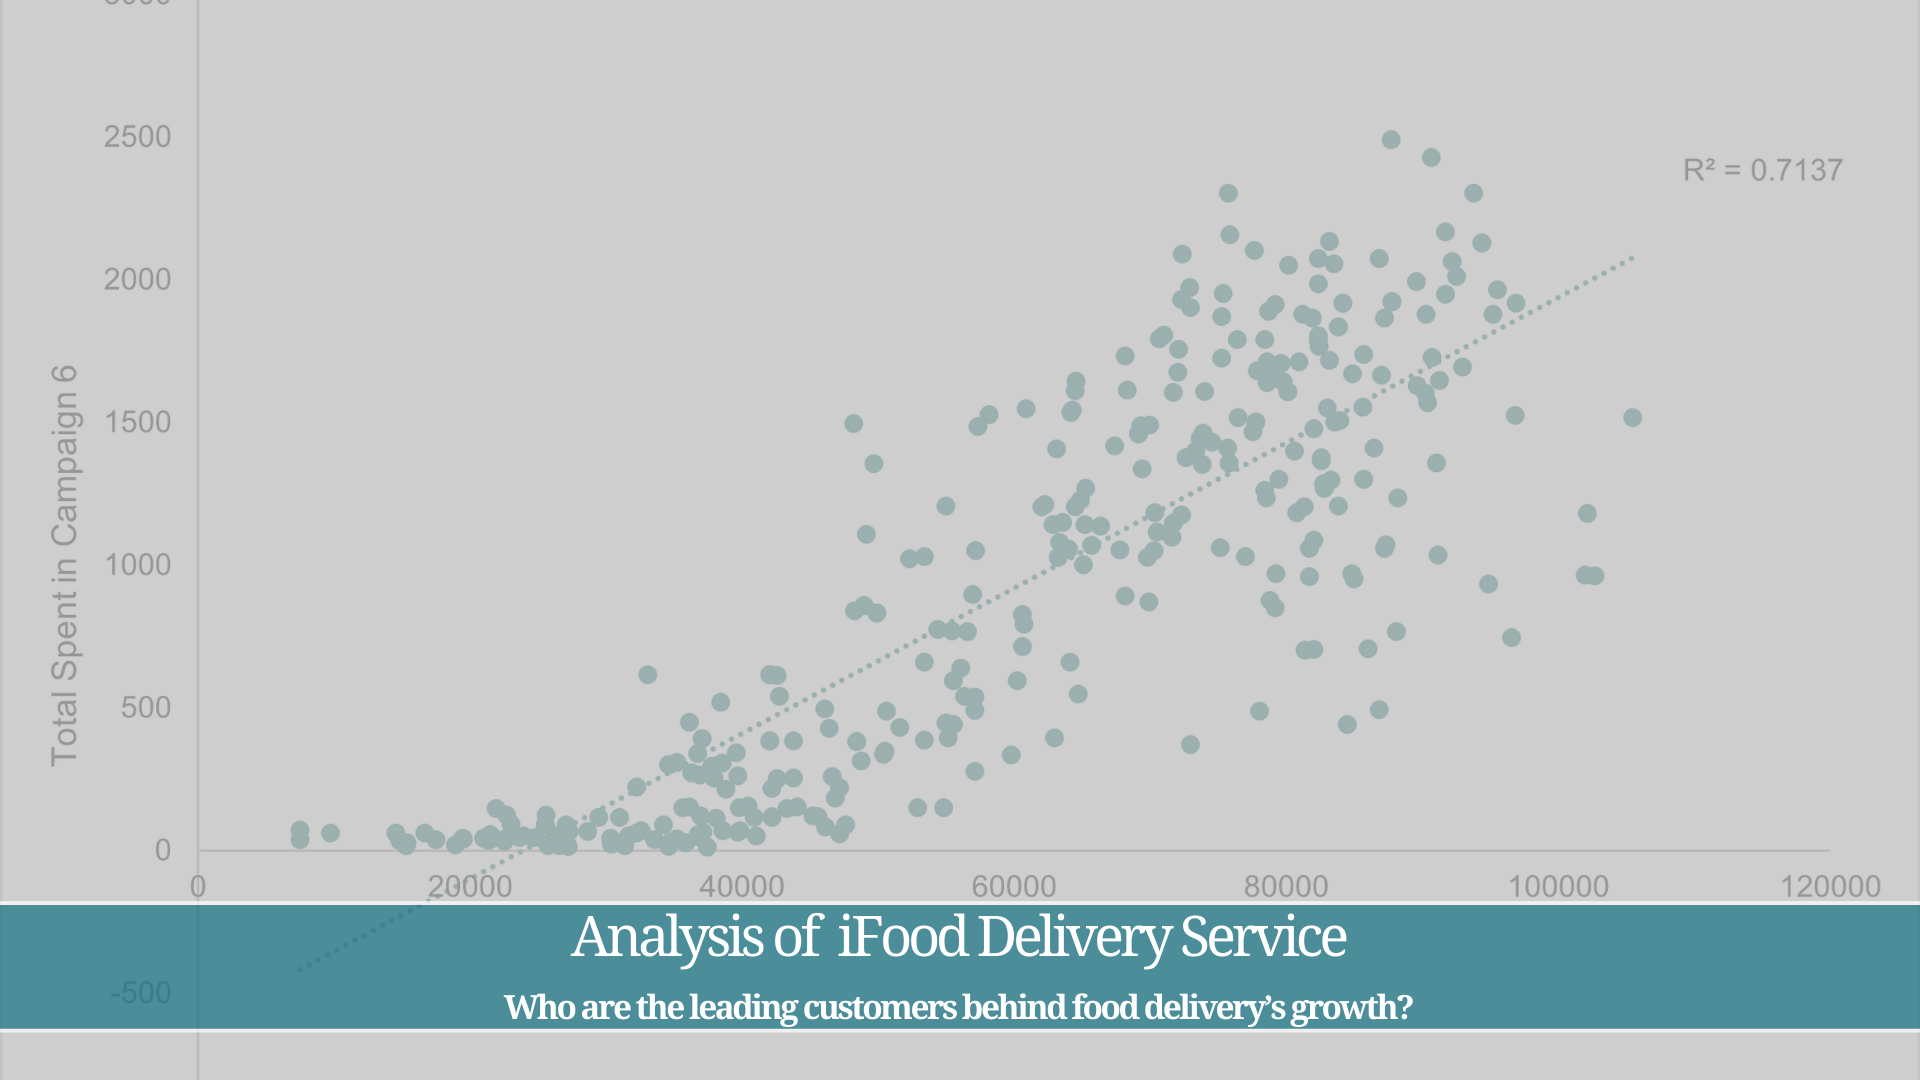 For this project, I explored what a good analytics PowerPoint presentation should entail. It has key insights, ties data to the business value and much more.